Stop Guessing, Start Tracing: Pinpointing Service Bottlenecks with OpenTelemetry
Diagnosing issues in software can often feel more like detective work than engineering. Imagine sitting in a doctor’s office. They ask, “How can I help?” You describe your symptoms, they perform their usual checks, and eventually, diagnose your condition. Simple enough, right?
But as software engineers, our “patient” might be a Java, Go, or Node service that isn’t performing well. We can’t exactly chat with it — at least, not yet. So, what’s the best way to understand why a service isn’t behaving as expected?
Diagnosing Services — More Detective Work Than Medicine
A few weeks ago, our team faced a classic issue: a service wasn’t consuming messages fast enough. Naturally, we gathered as a team and started asking questions. Initially, we individually dove into the codebase, while I added tracing to a few suspect areas. During the next meeting, a section of the code was quickly flagged as suspicious — admittedly, none of us clearly remembered why — but tracing would validate our hunch.
This scenario is surprisingly common:
- “The code looks like it could be slowing things down; it must be the problem.”
- Refactor the suspect code.
- No noticeable performance improvement.
We needed concrete data to identify the real bottleneck — that’s where tracing comes in.
Tracing vs. Logging vs. Metrics
Before we dive deeper, let’s clarify what tracing actually is.
Logging captures what happened in a system, often with verbose detail. Logs are great for debugging specific issues, but also when well structured, can drive alerts. Metrics provide a high-level, numerical view of system behavior over time. Metrics are excellent for tracking trends (e.g. request rates, CPU usage, latencies) and triggering alerts when thresholds are crossed. Modern metrics systems can break down latency per component, giving you detailed performance insights. However, they often lack request-level context and causality — they tell you what is slow, but not necessarily why. Tracing bridges this gap. It links together individual operations within a request, showing the full path that request takes through your services. Each trace includes timing information, metadata, and hierarchical relationships between operations, making it easy to see not just where time is spent, but how different services and components interact. Tracing is especially powerful for complex interactions involving multiple services, external API calls, or interactions with cloud providers.
Case Study: Chasing Performance Ghosts
Our tracing revealed that the initial suspect — the so-called “bad” code — was actually lightning-fast. The real culprit was less exciting but more impactful: we were spending too much time uploading large files to a cloud storage bucket. Recent data growth caused file sizes to balloon. Optimising file copying improved things, but still wasn’t sufficient.
Tracing provided granular, timestamped visibility into each step of our system’s workflow. By instrumenting the upload process, we observed unusually long spans specifically during the file compression phase. Grafana highlighted that compression accounted for over 80% of the total processing time, while our original hypothesis focused on the upload network speed.
Further examination showed that recent data growth had ballooned our JSON Lines (JSONL) files to around 40GB. We were using Zstandard (ZSTD), a compression algorithm known for high compression ratios but comparatively slower speeds when dealing with massive datasets.
Write on Medium Without tracing, identifying precisely which operation — uploading or compression — was causing delays would have been guesswork. Instead, tracing visualized this bottleneck directly, enabling us to confidently shift our optimization efforts toward compression rather than file transfers.
Our Observability Stack — Tools of the Trade
This experience solidified our observability approach, leading us to rely on a carefully chosen stack centered around OpenTelemetry:
Traces → OpenTelemetry SDK → OTel Collector → Tempo Metrics → Prometheus scraping /metrics endpoint → Mimir Logs → Promtail → Loki Frontend Visualization → Grafana Error Tracking → Sentry We specifically route only tracing data through the OpenTelemetry collector primarily for performance efficiency and because our existing infrastructure for metrics and logs already provides optimal handling.
Beyond Basic Spans — Getting More Value from Tracing
When engineers first explore tracing, they typically just create a few basic spans and stop there. However, tracing can offer far richer insights if used effectively:
Don’t overload traces: Keep spans lean, focused on core data: function execution time, outcomes, and key events. Capture errors and events: Explicitly record errors and notable events for better debugging. Here’s a simplified example in Go using OpenTelemetry:
// Start a new span for tracing
ctx, span := observability.StartSpan(ctx, "UploadFile")
defer span.End()

// Perform the file upload
resp, err := uploadFileToBucket()
if err != nil {
    span.RecordError(err, trace.WithStackTrace(true))
    span.SetStatus(codes.Error, err.Error())
    return
}
// Add important event details to span
span.AddEvent("File uploaded", trace.WithAttributes(attribute.String("file_id", resp.ID)))
Our custom wrapper function, observability.StartSpan, initializes spans and provides standardized error handling. Context (ctx) propagation ensures continuity across distributed services.
Connecting the Dots — Tracing, Logs, and Metrics
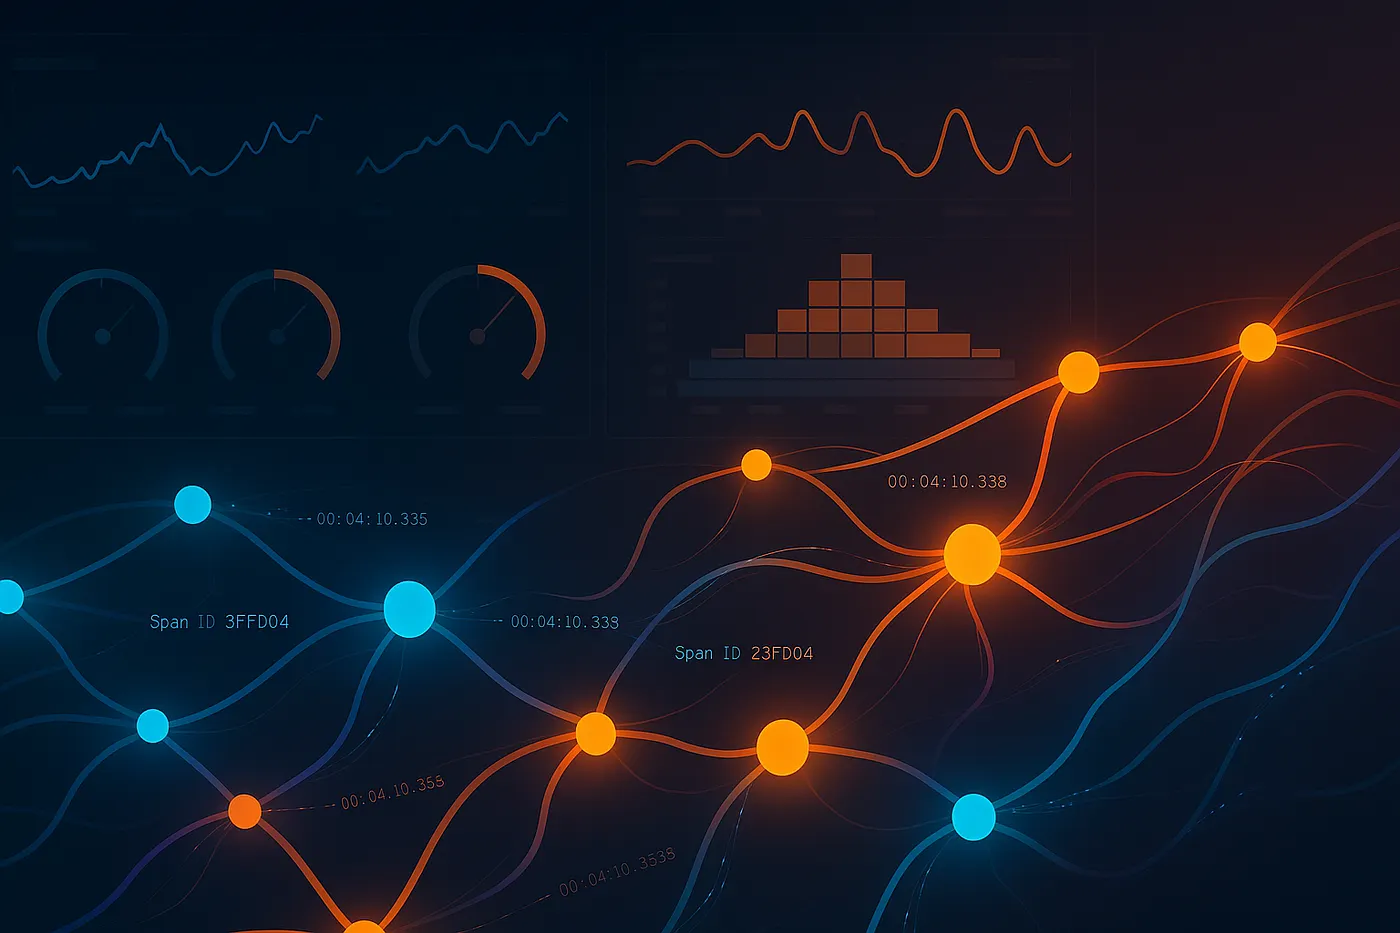
Click the image to view full size.
Grafana significantly enhances our workflow with its “trace-to-logs” integration. By embedding trace IDs directly into our logs (using Zerolog hooks), we can easily jump from a trace directly to the corresponding log entries.
By scoping logs to a specific span, we have a much faster way of getting the right log information. I often see engineers doing a generic search over a large logset, rather than determining where to start, then refining the search. This approach, in a pinch when on-call, reduces the time to resolution of issues.
Here’s how we integrate trace IDs with our logs in Go:
func setupZeroLog(level zerolog.Level) {
    sentryWriter := SentryWriter{hub: sentry.CurrentHub()}
    multi := zerolog.MultiLevelWriter(os.Stdout, sentryWriter)
    log.Logger = zerolog.New(multi).
        Level(level).
        Hook(TraceHook{}).
        With().
        Timestamp().
        Logger()
    zerolog.TimeFieldFormat = zerolog.TimeFormatUnix
}

type TraceHook struct{}

func (h TraceHook) Run(e *zerolog.Event, level zerolog.Level, msg string) {
    ctx := e.GetCtx()
    if ctx == nil {
        return
    }
    if span := trace.SpanFromContext(ctx); span != nil {
        sc := span.SpanContext()
        if sc.HasTraceID() {
            e.Str("trace_id", sc.TraceID().String())
            e.Str("span_id", sc.SpanID().String())
        }
    }
}
Practical Tips for Effective Tracing
Here are some best practices to maximize the value of tracing:
Avoid excessive spans in loops: Don’t flood your tracing system; aggregate repetitive tasks. Leverage built-in tracing: Many cloud/database SDKs have built-in OpenTelemetry support — use them! Standardise span attributes: Add consistent, searchable attributes (like IDs) to spans for easy filtering. Wherever possible, follow the OpenTelemetry semantic conventions for naming span attributes and operations. This helps ensure consistency across services and tools, and makes your traces more interoperable and readable, especially when visualized in tools like Grafana.
Observability Empowers Better Decisions
Tracing turned a suggestion of a problem into precise insights, transforming how we diagnose and solve performance issues. With OpenTelemetry and a well-designed observability stack, you can use data and analysis to drive decisions.
When your service starts feeling under the weather, tracing empowers you to quickly diagnose, understand, and heal your digital patient.